Inside the Virtual Machine
You will get this presentation below, where the only bookmark is the tutorial that you are doing now!
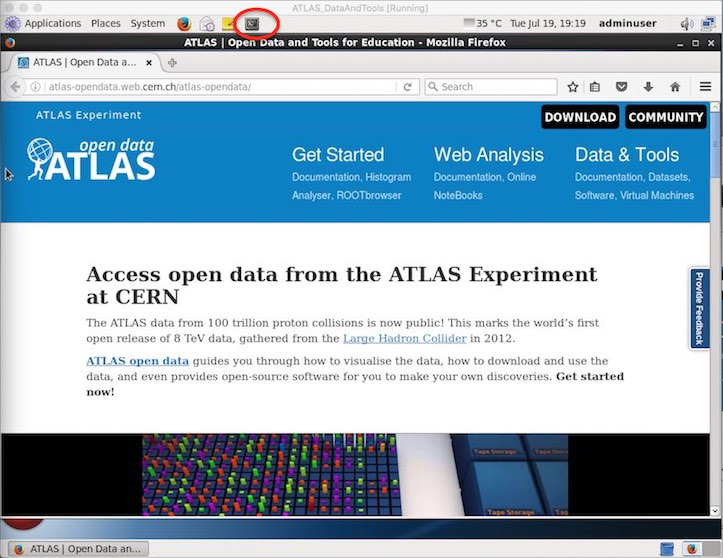
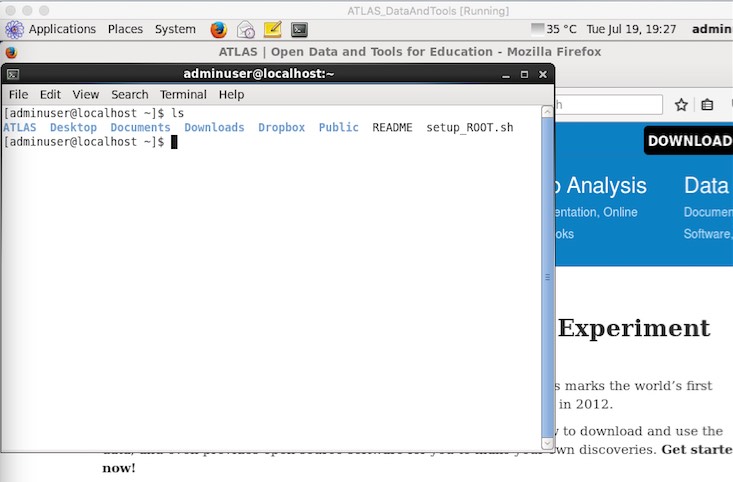
Open a new Terminal ( the icon is at the top, shown here circled in red) and type ls.
You will get the list of files: ATLAS, Desktop, Documents, Downloads, Dropbox, Public, README and setup_ROOT.sh
Go into the ATLAS/analysis folder
cd ATLAS/analysis
Run the script to setup ROOT.
source setup_ROOT.sh
Go into the atlas-outreach-data-tools-framework-1.0 folder
cd atlas-outreach-data-tools-framework-1.0
and list the files in the directory
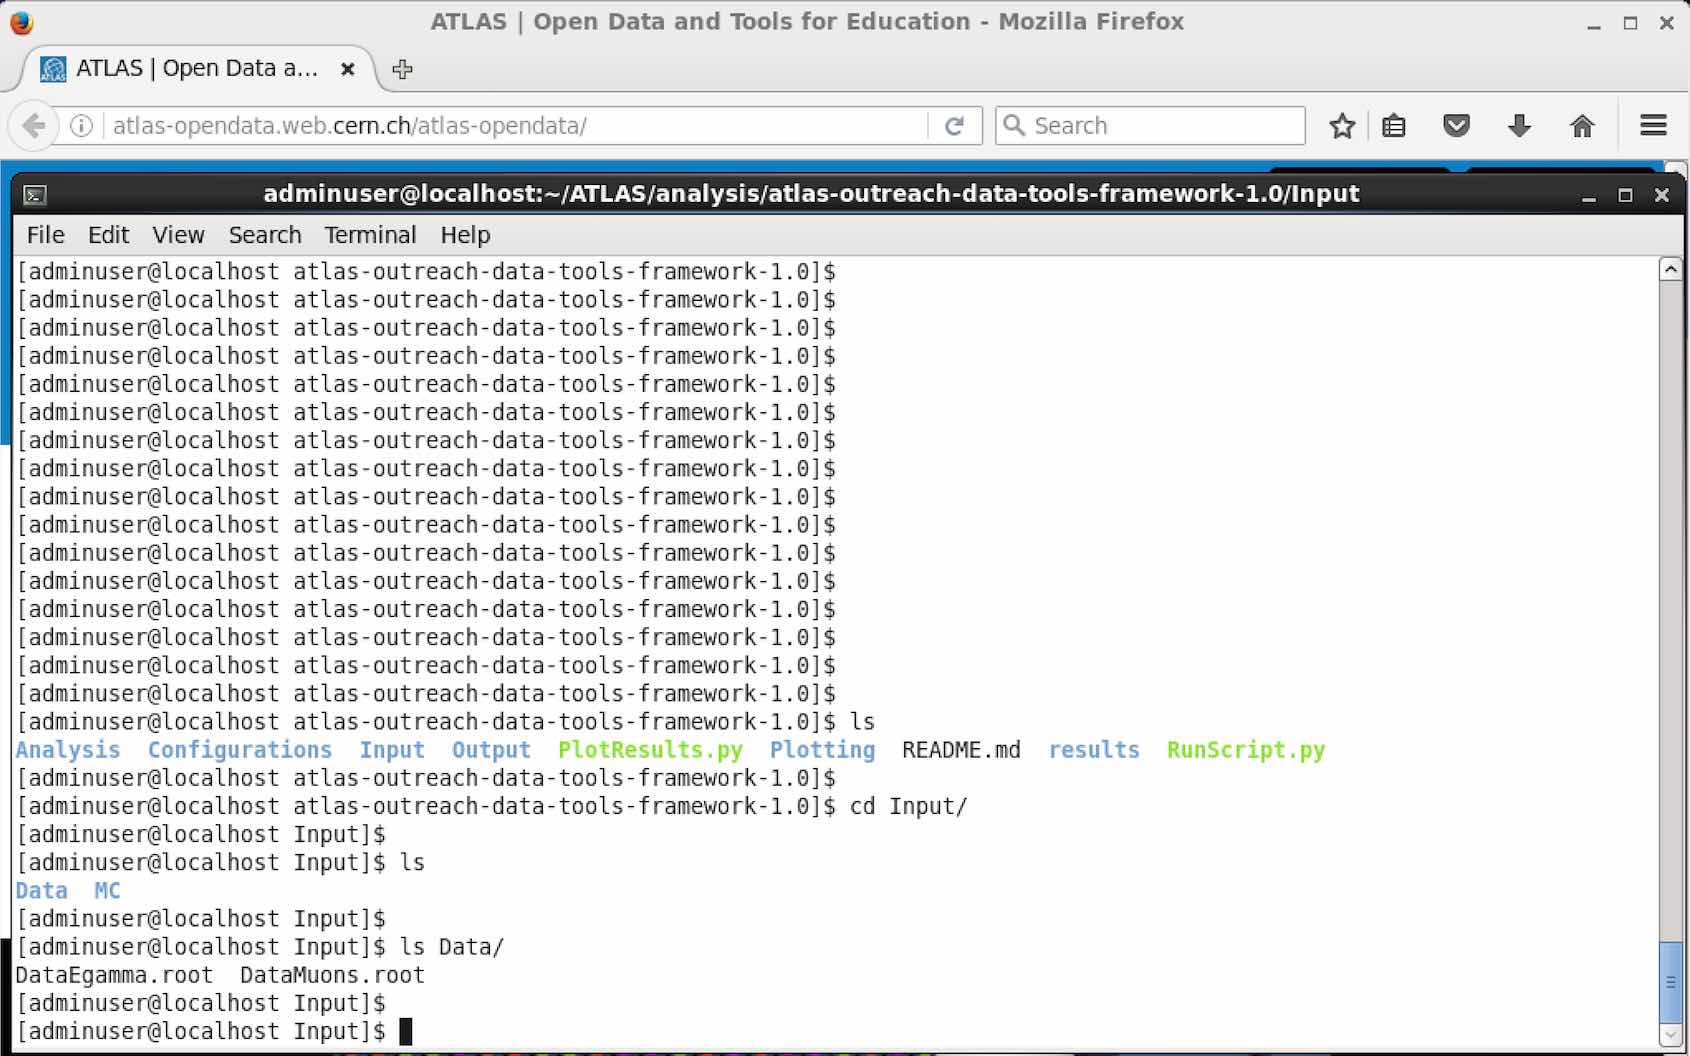
ls
Here you will see Analysis, Configurations, Input, Output, Plotting and results folders plus two python scripts and README.md

Take a look at the datasets.
Data and simulated data root ntuples are in the Input folder.
Take a look
cd Input
ls Data
You will see there are two datasets in the Data directory, DataEgamma.root and DataMuons.root
Now let's take a closer look at ome of these.
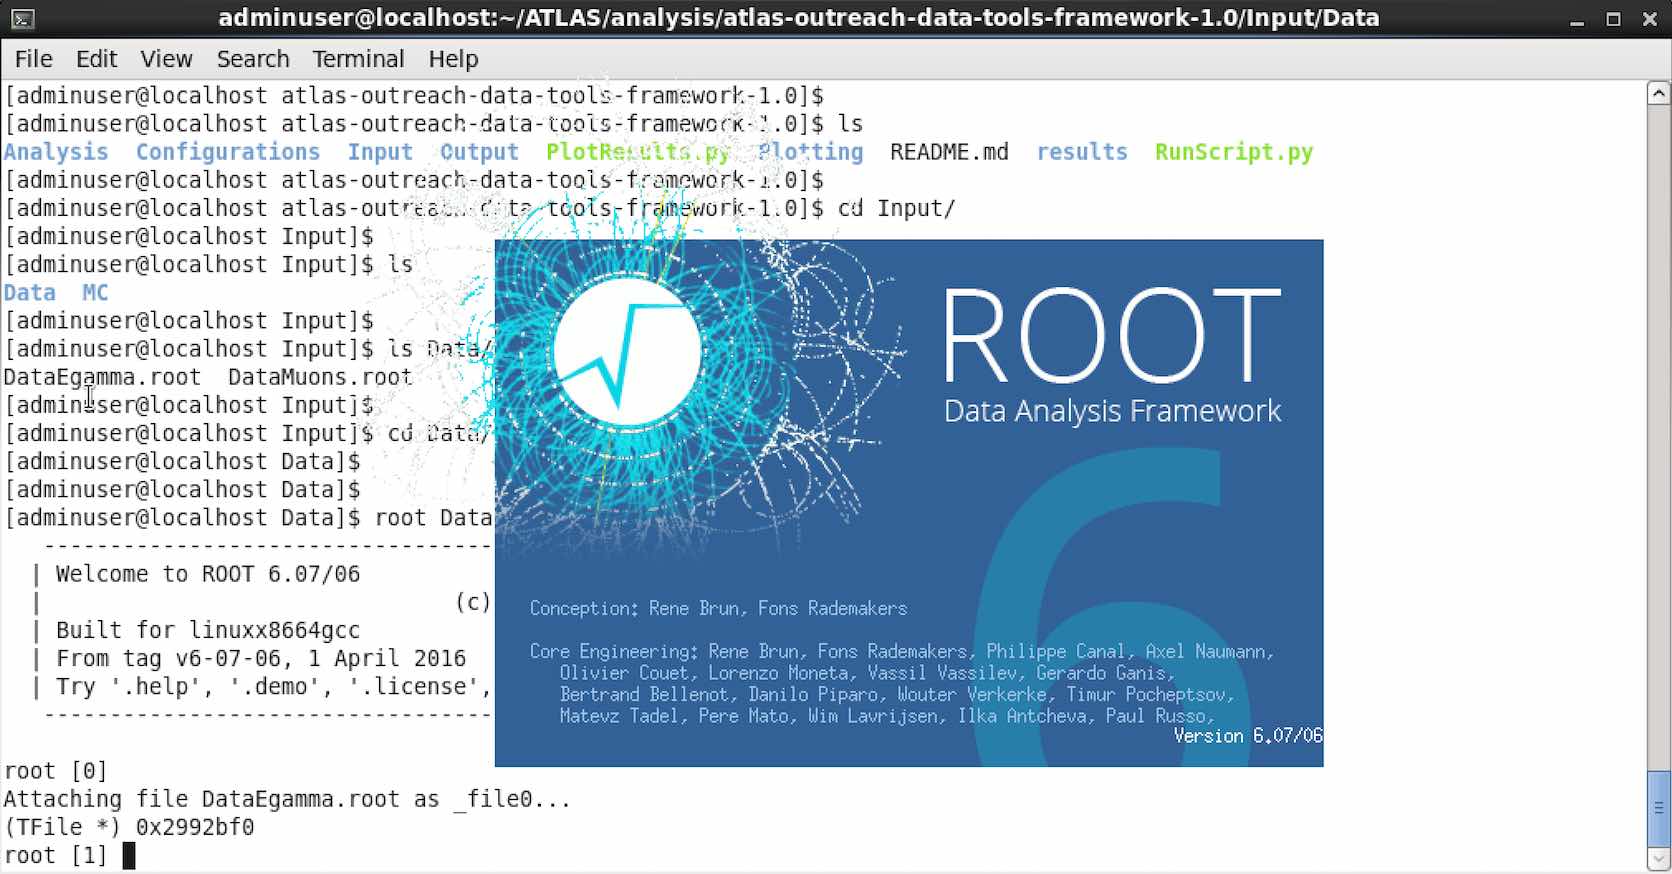
Launch root, attaching your chosen dataset
root Data/DataEgamma.root
Use Tbrowser to look at the different variables available.
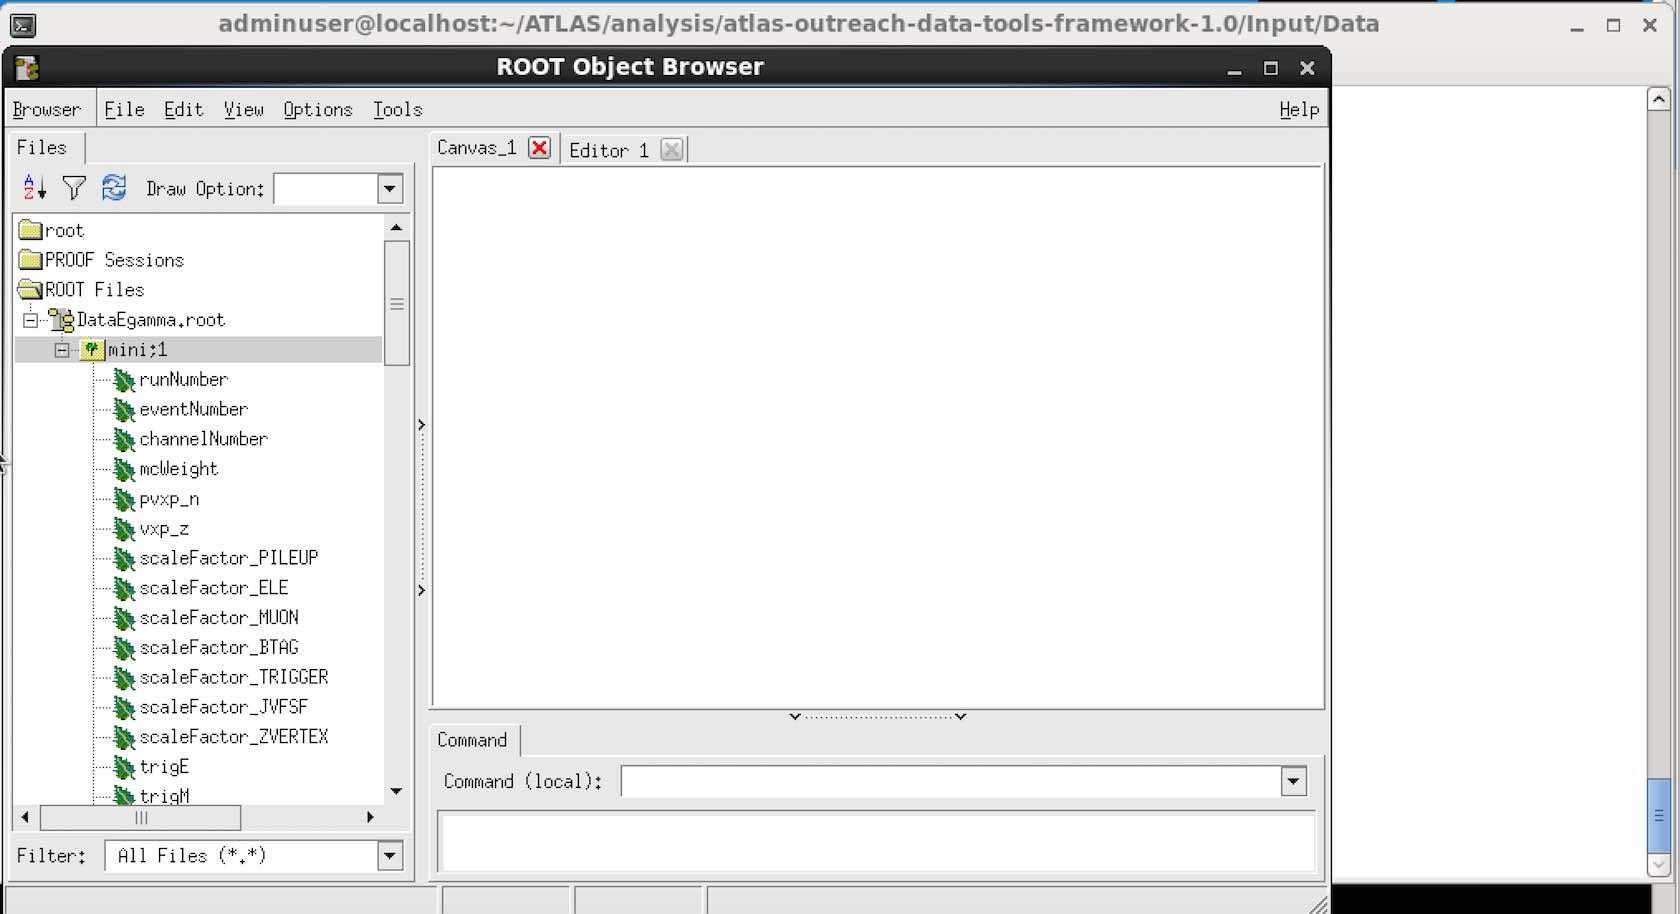
Then plot the variables.
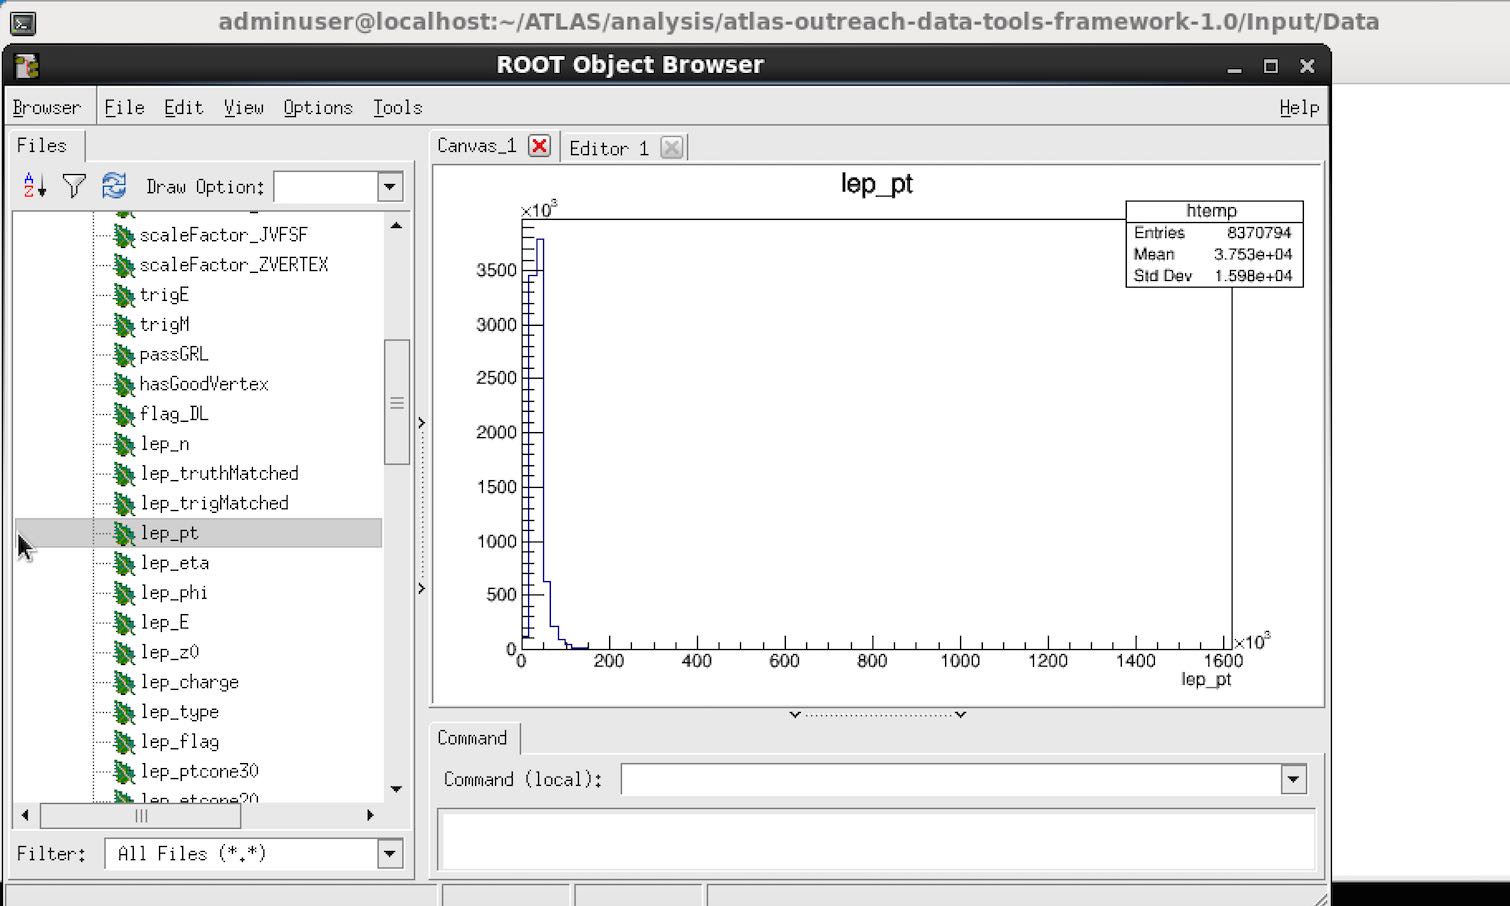
Take a look at some of the other variables. See if you can understand the shape of the distributions.
When you want to finish looking at the dataset, quit root
- q
Cloud client
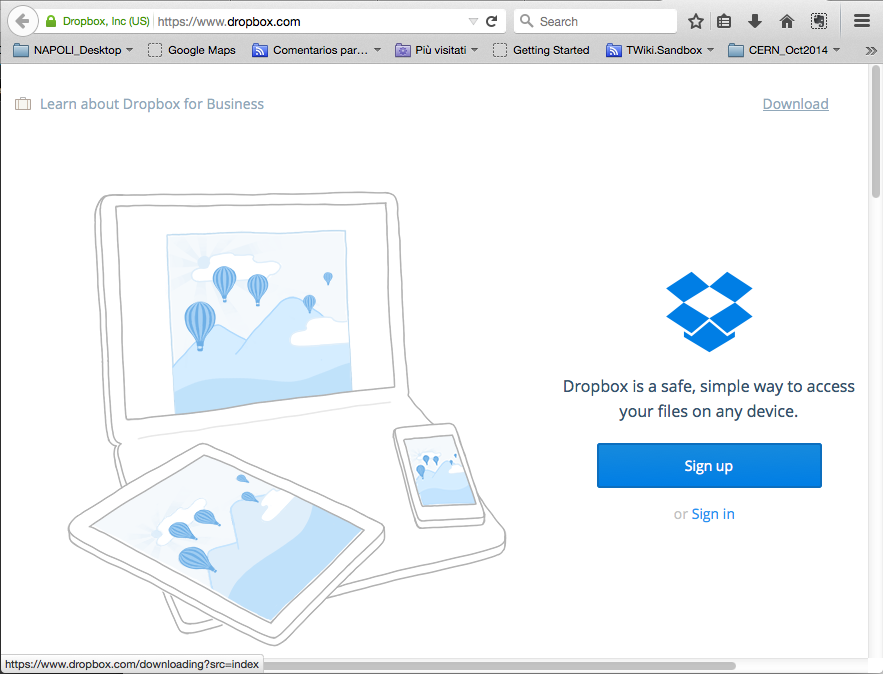
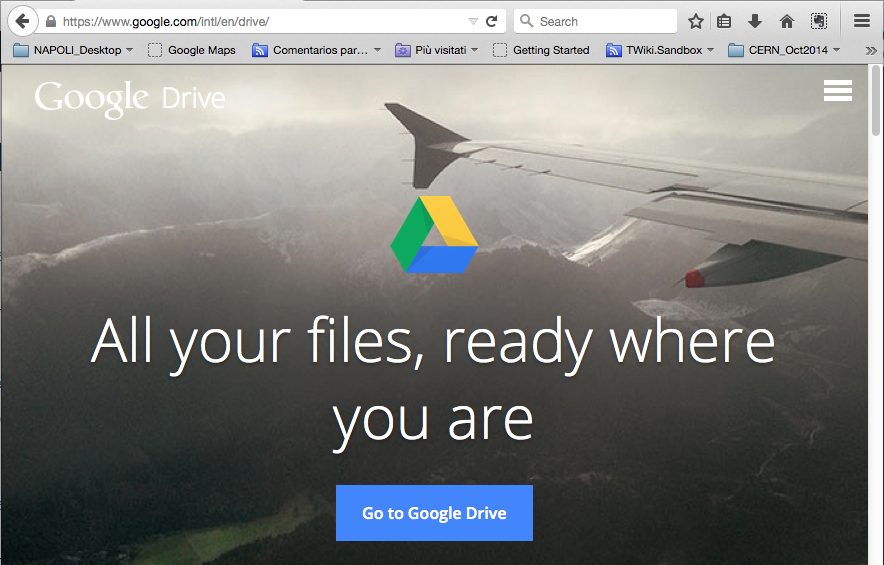
You can install a Cloud client to keep a real time contact with your two machines.
Use Dropbox (included) or Google Drive Client to share files between your VM and your host OS:
Now you are ready to start your analysis of the data.
Go to the Software Book to learn how to run and produce plots.