Take a look at the data
Watch the video 'Take a look at the data' to give you an idea what you need to do.
In your terminal window, you are in the main directory ATLAS-DataAndTools. Here you can two python scripts RunScript.py and PlotResults.py. These are the two key scripts you need to run an analysis.

You will see there are 6 folders:
Analysis: Code for 7 analyses have been prepared for you.
Configurations: The Configurations file for running and the PlotConf files for plotting are here.
Input: Contains the data and simulated data (MC) files.
Output: Your final plots are written here.
Plotting: Contains files defining how your plots will look like.
results: The histograms are written here when you run an analysis, which are then used for plotting.
[If you are using the small VM you may not initially have a results folder but you will have an additional file, DownloadScript.py ]
There are two steps to looking at the data. You must do step 1 followed by step 2.
Run an analysis using RunScript.py to produce histograms of individual variables eg jet_pt. The histograms are written to your results folder.
Plot the results using PlotResults.py to scale the histograms, colour them in and stack them. Combined plots are produced, for all the simulated and real data. These plots are written to your Output folder.

So let's have a go at the two steps !
Step 1: Run an analysis
In the Analysis folder, there are 7 analyses: TTbarAnalysis.py, WAnalysis.py, WZAnalysis.py, ZAnalysis.py, ZZAnalysis.py, ZPrimeAnalysis.py and HWWAnalysis.py
We will start by running TTbarAnalysis.
If you are running the large VM or running the software directly, then you can run all analyses over all data. This is great, but will take at least an hour. So be aware. It is a good idea to start by just running over a small fraction of the datasets. See below how to do this.
Running an analysis using the Small VM
If you are using the small VM, before you start, download the rest of the data. This can happen in the background, so that when you are ready to use all of the data, it will be ready for you. Type into the command line
python DownloadScript.py -q -a download &
The & is important, to allow you to continue working while the download occurs. The argument -a defines the action, which in this case is 'download' and -q sets output mode to quiet.
Now let's run the analysis.
Type into the command line
python RunScript.py -a TTbarAnalysis
This runs the code called TTbarAnalysis .
In this case -a defines the analysis to run.
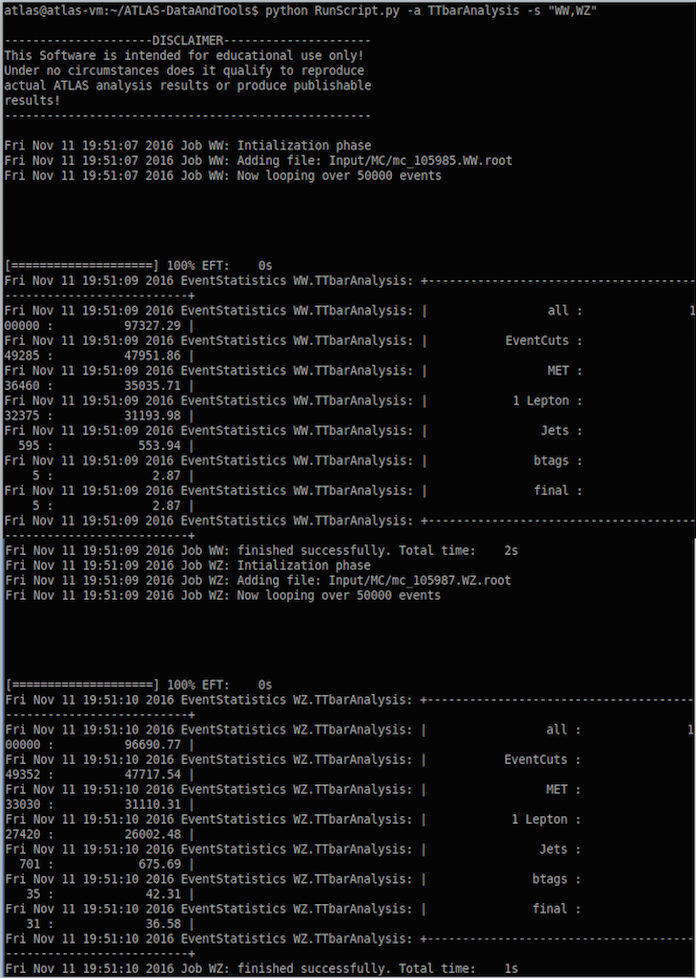
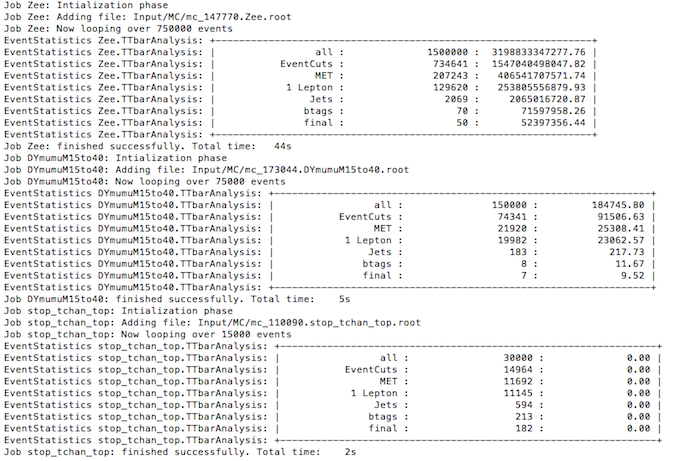
The analysis should run, taking just a few minutes, telling you about Event Statistics and complete by saying
Job WZ: finished successfully.
Running an analysis using the Large VM
If you are running the large VM, you need to run over all the datasets. However you can just run over a small fraction, to speed things up.
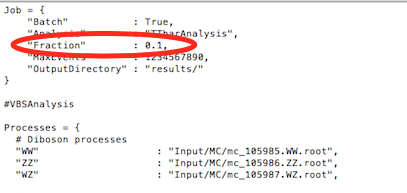
Modify Configurations/Configuration.py and change the fraction of code to run over from 1 to 0.1
This will then run ten times faster and should only take a few minutes. Remember if you want to run over all the data, you need to change this back to 1.
Using the vim editor
vim Configurations/Configuration.py
There are two modes in vim. One is the command mode and the other is the insert mode. Type
'i'
to enter insert mode so that you can modify the text. Change fraction to 0.1
To go from insert mode to command mode you need to type Esc (the escape key).
Then write and quit the file by typing
:wq
Now run the top pair analysis
python RunScript.py -a TTbarAnalysis
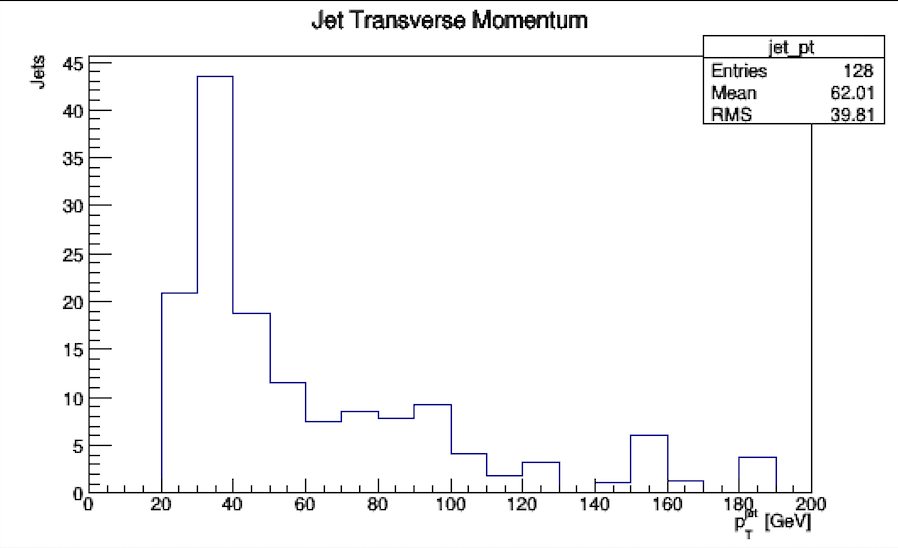
Histograms
Histograms are produced and put into the results folder.
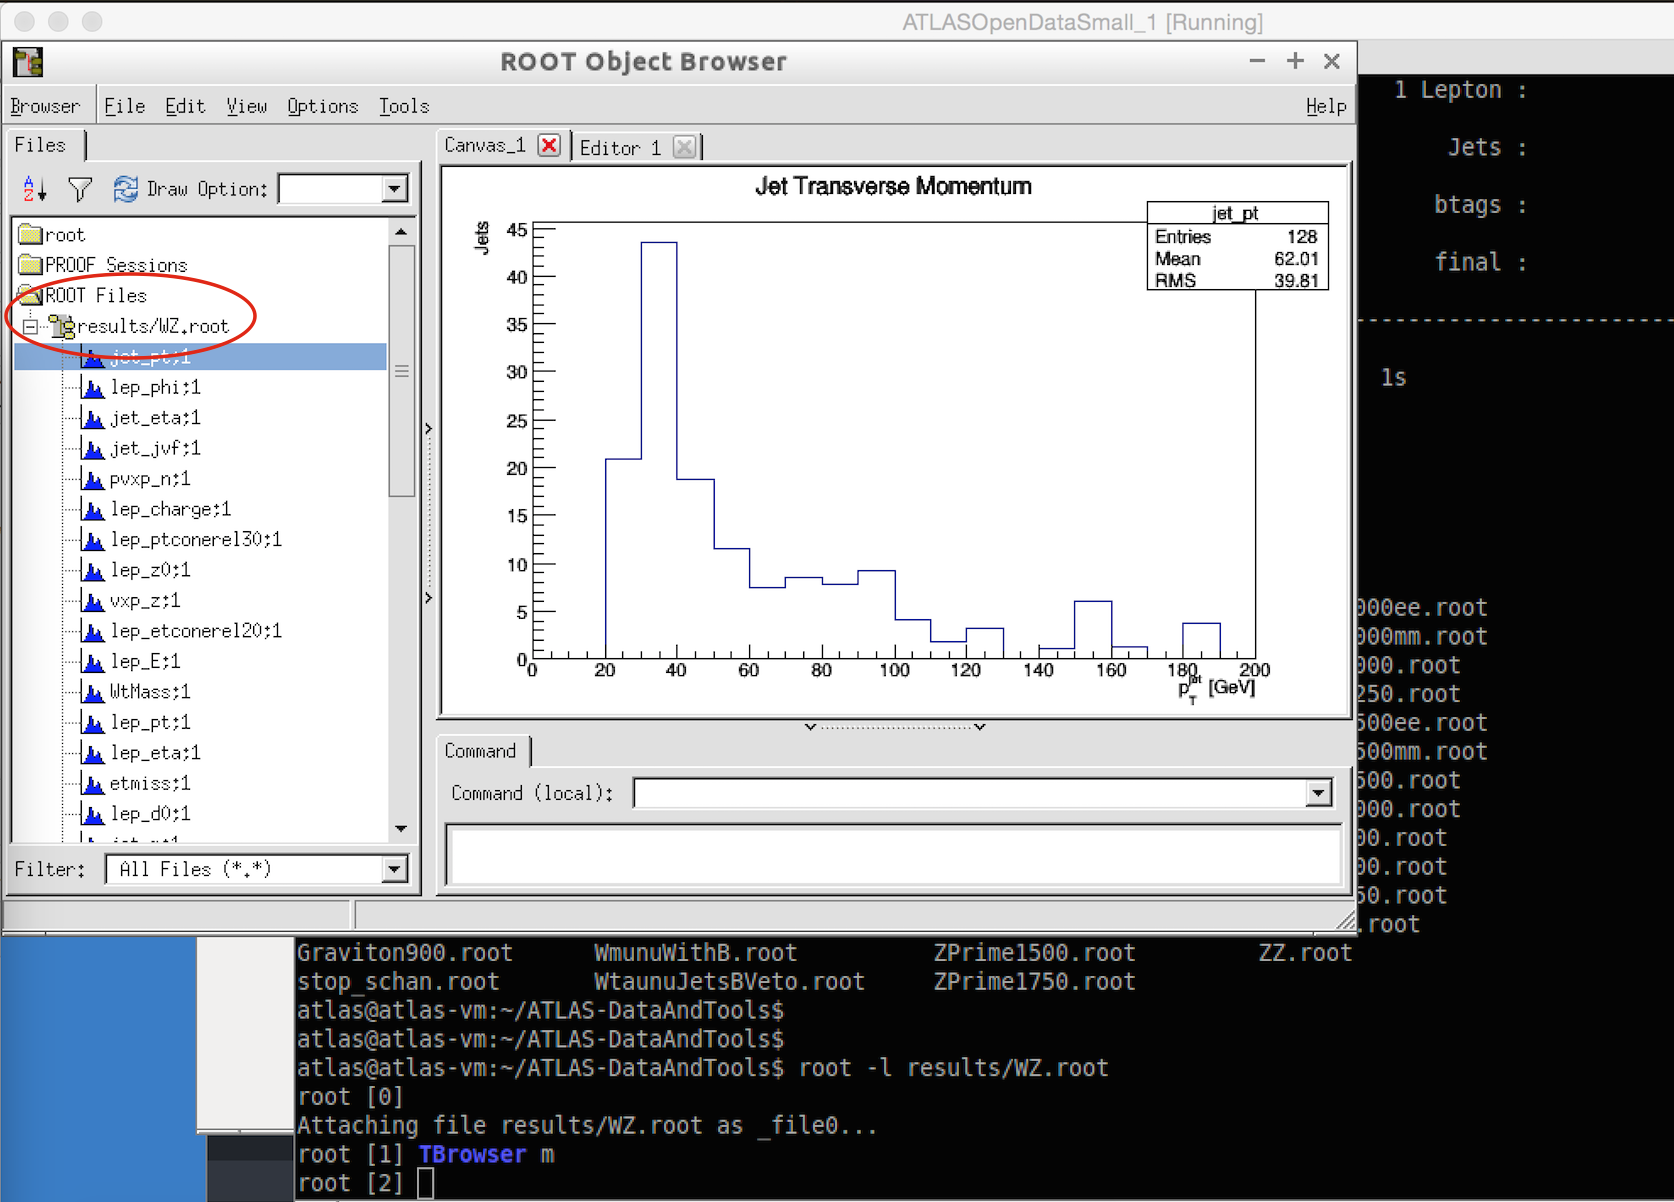
If you want to look at the histograms, launch root and specify the file you want to display
root -l results/WZ.root

TBrowser m
Then click on ROOT Files results/WZ.root to see all your histograms.
Click on a variable name to display the histogram.
To quit root and return to the command line prompt
.q
The RunScript has several options which are displayed by typing
python RunScript.py --help
The options include:
-a,            --analysis              overrides the analysis that is stated in the configuration file
-s,            --samples               comma separated string that contains the keys for a subset of processes to run over
-p,            --parallel              enables running in parallel (default is single core use)
-c CONFIGFILE, --configfile CONFIGFILE specifies the config file to be read (default is Configurations/Configuration.py)
-n NWORKERS,   --nWorkers NWORKERS     specifies the number of workers if multi core usage is desired (default is 4)
To run over the full set of available data samples (if you have downloaded them) takes between 1 to 1.5 hours in single core mode:
python RunScript.py -a TTbarAnalysis
Execution times are reduced to ~ 15 minutes in multi core mode:
python RunScript.py -a TTbarAnalysis -n 4
To speed things up, you can also run on just a few samples
python RunScript.py -a TTbarAnalysis -s "WW,WZ"
Step 2: Plot the results
The plotting configuration python scripts are in the Configurations folder. Here we use PlotConf_TTbarAnalysis.py since we ran TTbarAnalysis. If in the future you run one of the other analyses, then you should use the relevant plot configuration file.
python PlotResults.py Configurations/PlotConf_TTbarAnalysis.py
The resulting plots are put into the Output folder.
ls Output/
This will list the pdf files containing your plots.
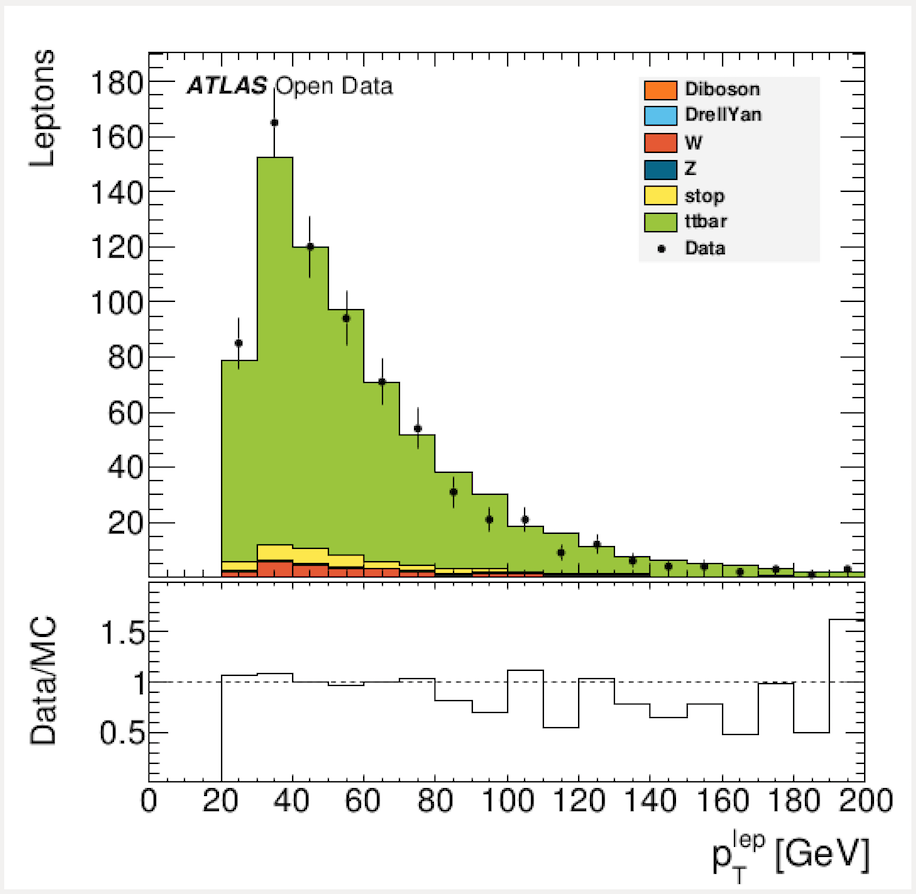
To display a plot use evince, for example
evince Output/lep_pt
Have a go at running one of the other analyses
Remember you need to run the two steps. and choose the plotting configuration file name to match the analysis you have run
e.g.
python RunScript.py -a WAnalysis
python PlotResults.py Configurations/PlotConf_WAnalysis.py